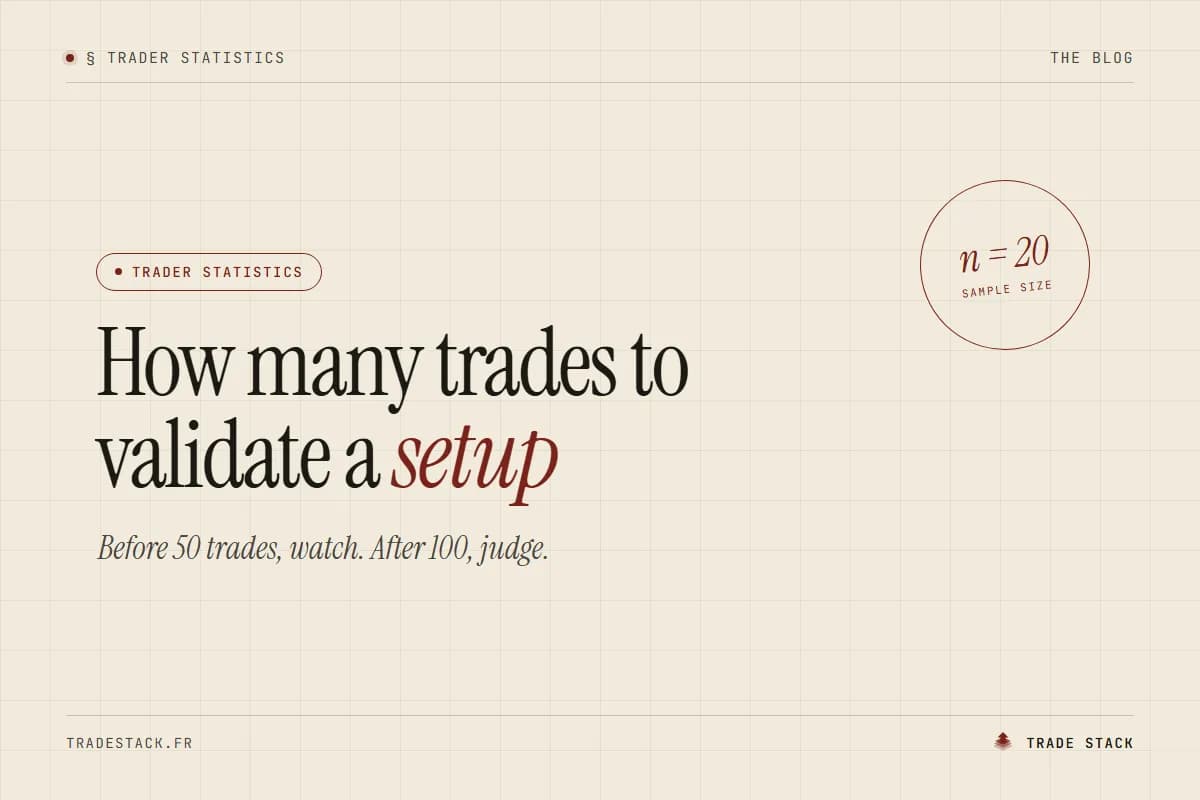
You need 50 to 100 trades of the same setup, taken with the same rules, before you can start judging it on its results. Over 20 trades, a setup that truly wins 45% of the time can show any win rate between 23% and 67%, and a winning setup looks like a losing one about one time in four.
You have been testing a new setup for three weeks. 20 trades, 12 winners: it works. You increase your size. The next 20 give 6 winners: it stopped working. You move on to another one. Nothing changed between the two runs: not the market, not your rules, not your execution. Only chance did.
That scene explains many strategies abandoned too early, and many bad ones kept too long.
Why do 20 trades prove nothing?
Because over a small sample, chance weighs more than your setup. Take a setup with a true win rate of 45%, an average win of 1.5 R and a loss of 1 R (example). Its expectancy is positive: 0.45 × 1.5 − 0.55 × 1 = +0.125 R per trade.
Here are two runs of 20 trades it can produce, without changing anything:
| Run | Winners | Losers | Result |
|---|---|---|---|
| A | 12 | 8 | +10 R |
| B | 6 | 14 | −5 R |
Each happens about one time in eight (13% each, binomial calculation). After run A, you conclude the setup is excellent. After run B, that it is dead. Both conclusions are wrong, and they describe the same setup.
What is the margin of error on your win rate?
It narrows as the sample grows, but slowly. The table below gives the range your measured win rate falls into 95 times out of 100, by true win rate and number of trades:
| True win rate | 20 trades | 50 trades | 100 trades | 200 trades |
|---|---|---|---|---|
| 35% | 14 to 56% | 22 to 48% | 26 to 44% | 28 to 42% |
| 45% | 23 to 67% | 31 to 59% | 35 to 55% | 38 to 52% |
| 55% | 33 to 77% | 41 to 69% | 45 to 65% | 48 to 62% |
To halve the margin, you need four times as many trades. Going from 50 to 200 trades only narrows the range from ±14 points to ±7.
The rows overlap for a long time. Over 50 trades, a 35% setup and a 45% setup can both show a measured win rate around 40%. You cannot tell them apart before several hundred trades.
How often does a winning setup look like a losing one?
More often than you would think. Same example setup (45% win rate, +1.5 R, −1 R, expectancy +0.125 R per trade). Probability that its total result is negative after n trades:
| Trades | Probability of being in the red |
|---|---|
| 20 | 25% |
| 50 | 20% |
| 100 | 13% |
| 200 | 7% |
The reverse is also true. A setup with no edge at all (40% win rate, +1.5 R, −1 R, zero expectancy) ends up in the green roughly 40 to 46% of the time, whether you measure it over 20, 50 or 100 trades. Over a small sample, a setup with no edge often looks like a good one. That is also why losing streaks are so hard to read.
Count your trades per setup before you judge →
What can you judge before 50 trades?
Your execution, not your results. The two questions do not need the same sample:
- Did I follow my rules? Entry as planned, stop where intended, size calculated, exit respected. You can check this trade by trade, from the first one.
- Does the setup have an edge? That only shows over a large enough sample, and only if the answer to the first question is yes.
A simple rule to write down before starting a test:
- 0 to 20 trades: check execution only. No rule changes.
- 20 to 50 trades: watch the win rate and average R, without concluding.
- After 50 trades: first review. If results are far outside the table's range, investigate.
- After 100 trades: judge.
Which mistakes ruin a sample?
Mixing setups. One sample = one setup. If your 50 trades contain three setups, you are measuring an average that describes none of them. Tag each trade with its setup when you log it.
Changing the rules midway. Every change (new filter, moved stop, different timeframe) resets the count. Note the date and start a new sample.
Judging in dollars. One exceptional win on a bigger size can carry a whole month. Count in R, the multiple of your risk, so every trade weighs the same. The six performance metrics cover what to track alongside.
The limits of these numbers
- Trades are assumed independent. In practice, trades taken in the same market context are linked. Real uncertainty is usually larger than the table.
- The setup is assumed stable. A setup can work in one market regime and not in another.
- The range is an approximation. It uses the normal approximation, less precise for small samples and extreme win rates. The order of magnitude holds.
- Win rate is not enough. Results in R are even less stable over a small sample.
This content is educational and is not investment advice. Trading involves a risk of capital loss.
Counting trades per setup on Trade Stack
On Trade Stack, the By setup view of the Overview (Pro plan) shows the number of trades, the win rate and the average R for each setup, side by side. Before reading the win rate, read the first number: below 50, you are still looking at an impression.
Key takeaways
- Over 20 trades, a true 45% win rate can be measured anywhere between 23% and 67%.
- Halving the margin of error takes four times as many trades.
- A winning setup looks like a loser one time in four after 20 trades, one time in eight after 100.
- Before 50 trades, judge your execution. After 100, judge the setup.
- One sample = one setup, identical rules, results in R.
Frequently asked questions
How many trades does a reliable backtest need?
The same orders of magnitude apply: at least 100 trades per setup, ideally across several market regimes.
My setup only gives 5 trades a month. What should I do?
Judge execution every month and results once a year. Add a backtest with identical rules, or test the setup on several markets if its rules apply unchanged.
Method: 95% confidence interval using the normal approximation, p ± 1.96 × √(p(1 − p)/n), rounded to the nearest point. Negative-result probabilities and runs A and B: exact binomial distribution (win 1.5 R, loss 1 R). All setups are examples.