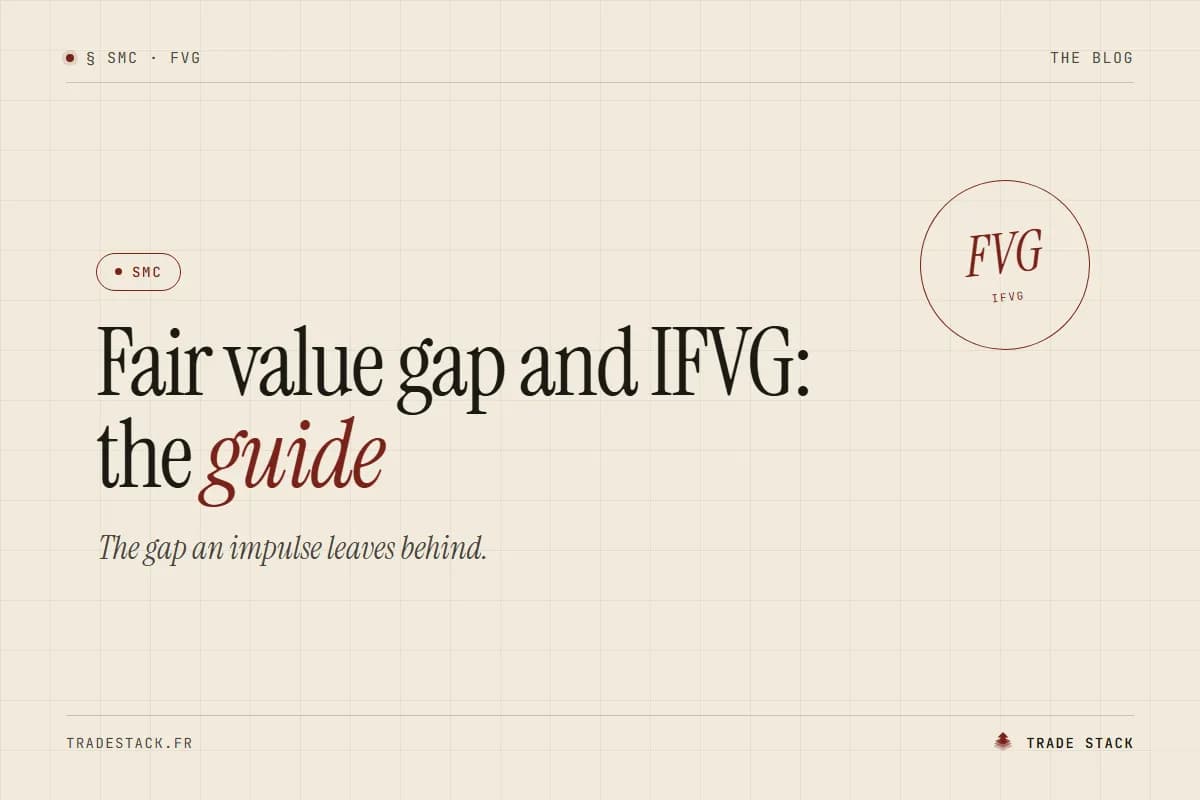
A fair value gap (FVG) is a price area left empty by an impulse: across three consecutive candles, the gap between the high of the first and the low of the third (for a bullish FVG). Price often comes back to it. What it does next, react or cut through, cannot be guessed: it has to be measured.
You drew a clean FVG on the M15. Price returns, taps the middle of the zone and moves your way. Next day, same pattern, same entry: price slices through the zone and takes your stop. On the chart, both gaps looked alike. What set them apart was elsewhere: the higher-timeframe context, the size of the gap, how many times it had been visited.
This guide covers the definition, the reading rules, and above all the grid that tells you, on your own trades, which FVGs are worth taking.
What is a fair value gap?
It is an imbalance between buyers and sellers, visible over three candles. The middle candle is a long impulse candle. If the low of the third candle stays above the high of the first, the space between them was only crossed in one direction: that is a bullish FVG.
| Type | Condition | Zone |
|---|---|---|
| Bullish FVG | Candle 3 low > candle 1 high | From candle 1 high to candle 3 low |
| Bearish FVG | Candle 3 high < candle 1 low | From candle 1 low to candle 3 high |
The term comes from the ICT method, part of Smart Money Concepts. The phenomenon itself is old: an intraday gap, a stretch where price moved too fast for supply and demand to meet.
An FVG often comes with an order block: the impulse leaving the order block frequently leaves a gap behind it.
What happens when price returns to an FVG?
Three outcomes, and your journal should tell them apart.
- Reaction. Price enters the zone, partly fills it, and resumes in the direction of the impulse.
- Full fill. Price crosses the whole zone. The imbalance is gone.
- Inversion (IFVG). Price crosses the zone, closes beyond it, then retests it from the other side. A bullish FVG broken to the downside becomes resistance: an inverse fair value gap.
Many traders use the midpoint of the zone (50%, called "consequent encroachment" in ICT terms) as their entry or invalidation reference. It is a convention, not a law: if you use it, use it on every trade.
How to read an FVG: four filters
- Higher-timeframe direction. A bullish M15 FVG carries more weight when the H4 structure is bullish.
- Break of structure. An FVG created by the impulse that breaks a high (BOS) has context. One in the middle of a range does not.
- First visit. A zone that has already been revisited has used up part of its orders.
- Size. A tiny gap relative to current volatility (say, under a third of the ATR) often fills with no meaningful reaction.
These filters are hypotheses to test on your data, not guarantees.
A worked example
EURUSD, M15, bullish H4 structure (example figures, not a recommendation):
| Item | Level |
|---|---|
| Candle 1 high | 1.0850 |
| Candle 3 low | 1.0862 |
| Bullish FVG | 1.0850 to 1.0862 (12 pips) |
| Entry at mid-zone | 1.0856 |
| Stop below candle 1 low | 1.0838 (18 pips) |
| Target: previous high | 1.0900 (44 pips) |
| Ratio | 44 ÷ 18 ≈ 2.4 R |
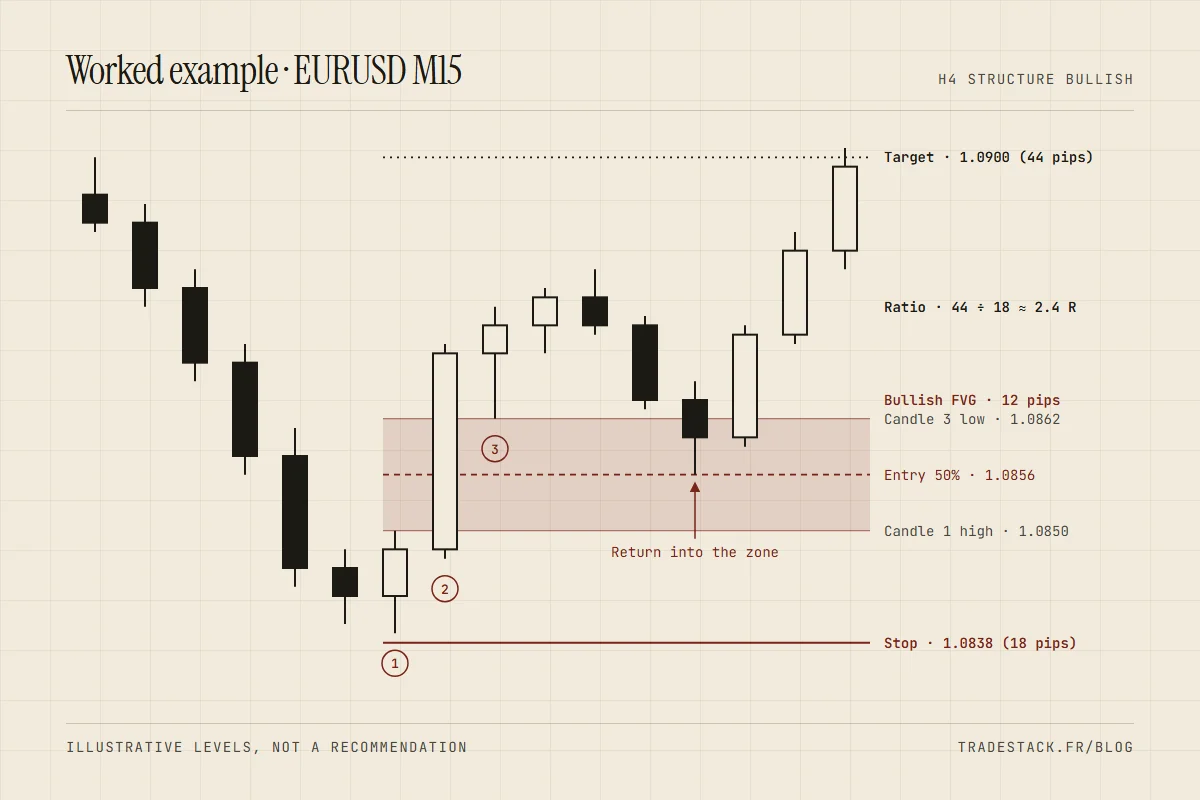
Risking 1% of a $10,000 account ($100), at $10 per pip for a standard lot on EURUSD (check with your broker), the size is 100 ÷ (18 × 10) ≈ 0.55 lot, rounded down to 0.5 lot. The stop sits where the idea is invalidated, below the impulse, not mid-zone where a simple sweep would hit it.
If price closes below 1.0850 on the M15, the FVG is filled: the idea is over, even if the stop has not been hit. If price then retests 1.0850 from below and turns down, that is an IFVG: a different setup, with its own rules.
Tag the FVG confluence on your next trades →
How do you measure your FVG reaction rate?
That is the only question that matters, and no article can answer it for you: the reaction rate depends on your market, timeframe and filters. Numbers quoted without method or sample size mean nothing for your trading.
The grid to fill for every FVG you trade, or could have traded:
| Field | Example value |
|---|---|
| Market and timeframe | EURUSD, M15 |
| Higher-timeframe direction | Aligned / against |
| Created by a BOS | Yes / no |
| Visit | 1st / 2nd or later |
| Zone size | 12 pips, i.e. 0.6 ATR |
| Outcome | Reaction / fill / inversion |
| Result | In R |
After 50 logged FVGs, compare subgroups: aligned versus not aligned, first visit versus later visits. You will see which filter actually makes a difference. Before 50, stay cautious: sample size explains why 20 cases prove nothing.
Classic mistakes
Seeing them everywhere. On an M1 chart, every impulse leaves an FVG. Without a context filter, the zone says nothing.
Confusing a fill with a reaction. A wick that taps the zone and leaves is not the same as a close through it. Decide in advance what invalidates your idea.
Placing the stop inside the zone. Price often goes deep into an FVG before reacting. A mid-zone stop is a hunted stop.
Changing the definition from chart to chart. Wick or body, 50% or zone edge: if the rule changes between trades, your statistics become unreadable.
The limits of the FVG
- It describes, it does not predict. A price gap does not force the market to come back. Some FVGs stay open for weeks.
- The institutional story cannot be verified. "Institutions come back to fill their orders" is a plausible explanation, not something a retail trader can observe. What you can observe is price reaction on your trades.
- Results depend on the market. An index FVG at the US open does not behave like a currency FVG in the Asian session.
This content is educational and is not investment advice. Trading involves a risk of capital loss.
Measuring your FVGs on Trade Stack
On Trade Stack, add "FVG" to your Confluences (Settings): the tag shows up in every trade form. Tick it, add the outcome in a short note, and the By setup view (Pro plan) gives you the win rate and average R of your FVG trades compared with the rest.
Measure my FVGs on Trade Stack
Key takeaways
- An FVG is the gap between candle 1's wick and candle 3's wick, left by an impulse.
- When price returns: reaction, full fill, or inversion (IFVG).
- Common filters: higher-timeframe direction, break of structure, first visit, size relative to volatility.
- The stop goes where the idea is invalidated, below the impulse, not inside the zone.
- Your FVG reaction rate is measured on your trades, after at least 50 cases logged with the same grid.
Frequently asked questions
What is the difference between an FVG and an order block?
The order block is the last opposite candle before the impulse. The FVG is the gap the impulse itself leaves. They often appear together.
Does an FVG always get filled?
No. Many do, some stay open for a long time. Do not build a trade on the idea that a fill is guaranteed.
Method: worked example built for illustration (fictional levels; pip value for a standard lot to check with your broker). No reaction rate is quoted: it depends on market, timeframe and filters, and must be measured on your own trades.